2018 CFA Level 2 Study Note Book1
Teks penuh
Gambar

Garis besar
Dokumen terkait
estimated stock value based on comparables and the takeover premium.. Step 2: Calculate various relative value measures based on the current market prices of companies in
Calculate the value of the equity forward contract to the long position, assuming the risk-free rate is still 5% and the yield curve is flat... One month ago, Troubadour
Calculate the forecasted active return and active risk of the managed portfolio using the actual active weights.
LO.h: Calculate and interpret the value at expiration, profit, maximum profit, maximum loss, and breakeven underlying price at expiration of the following option strategies: bull
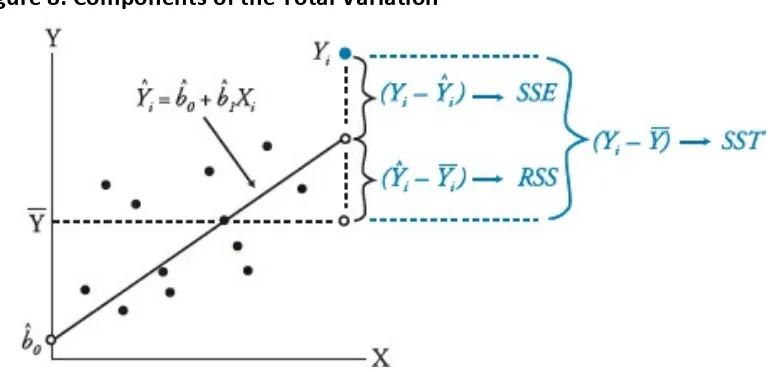
As SEE rises, also increases, and the confidence interval widens because SEE measures the variability of the data about the regression line, and the more variable the data,
hypothesis may have either of the two signs: < or >. Donald: Specifying the significance level, α, isn‟t a necessary step and one could do without it during hypothesis
hypothesis of two tailed test at given level of significance.. All
For absolute return series, Lo statistic rejects the null hypothesis at 1% level of significance for all the ten indices but in case of squared return series, the null of no long range
