Probability Statistics for Engineers Scientists
Teks penuh
Gambar
Garis besar
Dokumen terkait
One can glean from the two examples above that the sample information is made available to the analyst and, with the aid of statistical methods and elements of probability,
A large number of practical situations can be described by the repeated per- formance of a random experiment of the following basic nature: a sequence of trials is performed so that
In the case of tossing a coin three times, the variable X, representing the number of heads, assumes the value 2 with probability 3/8, since 3 of the 8 equally likely sample
Probabilities associated with binomial experiments are readily obtainable from the formula b ( x ; n, p ) of the binomial distribution or from Table A.1 when n is small. In
The point and interval estimations of the mean in Sections 9.4 and 9.5 provide good information about the unknown parameter µ of a normal distribution or a nonnormal distribution
For example, if the test is two tailed and α is set at the 0.05 level of significance and the test statistic involves, say, the standard normal distribution, then a z-value is
In a properly designed A/B test, you collect data on treatments A and B in such a way that any observed difference between A and B must be due to either: Random chance in assignment of
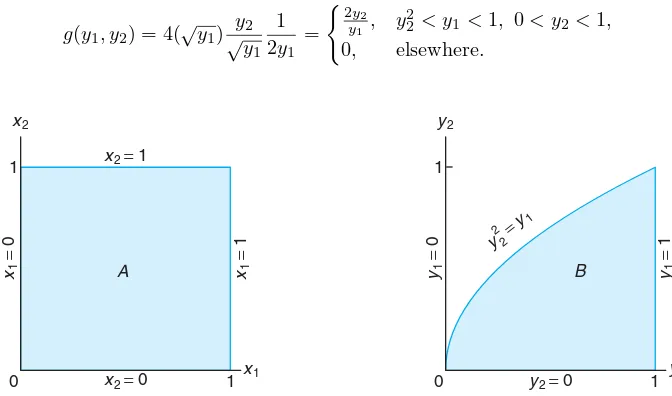
If the joint probability density function of continuous random variables Xand Yis fXYx, y, the marginal probability density functionsof Xand Yare 5-16 where Rx denotes the set of all
